Panmodernism by Mark Bloch
As collected from the Internet, mostly from
Wikipedia, with humility and profound
gratitude with no claims of ownership,
except for the Panmodern concept itself,
which, if you read all of this as I have,
you will vaguely understand. I am
thankful for all the authors of this
material and their ideas. All rights
reserved, all wrongs
reversed.
Diffusion of innovations
From Wikipedia, the free encyclopedia
Jump to: navigation, search
Diffusion of innovation is a theory of how, why, and at what rate new ideas and technology spread through cultures. Everett Rogers introduced it in his 1962 book, Diffusion of Innovations, writing that "Diffusion is the process by which an innovation is communicated through certain channels over time among the members of a social system."[1]
Contents[hide] |
The S-Curve and technology adoption
The adoption curve becomes an s-curve when cumulative adoption is used.
Rogers theorized that innovations would spread through a community in an S curve,[2] as the early adopters select the innovation (which may be a technology) first, followed by the majority, until a technology or innovation has reached its saturation point in a community.
According to Rogers, diffusion research centers on the conditions which increase or decrease the likelihood that a new idea, product, or practice will be adopted by members of a given culture. According to Rogers people’s attitude toward a new technology is a key element in its diffusion. Roger’s Innovation Decision Process theory proposes that innovation adoption is a process that occurs over time through five stages: Knowledge, Persuasion, Decision, Implementation and Confirmation. Accordingly, the innovation-decision process is the process through which an individual or other decision-making unit passes 1. from first knowledge of an innovation, 2. to forming an attitude toward the innovation, 3. to a decision to adopt or reject, 4. to implementation of the new idea, and 5. to confirmation of this decision.[3]
Much of the evidence for the diffusion of innovations gathered by Rogers comes from agricultural methods and medical practice.
Various computer models have been developed in order to simulate the diffusion of innovations. Veneris[4] [5] developed a systems dynamics computer model which takes into account various diffusion patterns modeled via differential equations.
There are a number of criticisms of the model which make it less than useful for managers. First, that technologies are not static, there is continual innovation in order to attract new adopters all along the S-curve, the S-curve does not just 'happen'. Instead, the s-curve can be seen as being made up a series of 'bell curves' of different sections of a population adopting different versions of a generic innovation.
See also
- Bass diffusion model
- Crossing the Chasm
- Development communication
- Early adopter
- Lazy User Model
- Logistic function
- Normalization Process Theory
- Technology acceptance model
- Technology adoption lifecycle
- Technology lifecycle
References
1. ^ Rogers, Everett M. (2003).Diffusion of Innovations, 5th ed.. New York, NY: Free Press.
2. ^ Rogers, Everett M. (1962). Diffusion of Innovations, Glencoe: Free Press, Ch. 7.
3. ^ Rogers, Everett M. (2003). Diffusion of Innovations, 5th ed.. New York, NY: Free Press, 161
4. ^ Veneris, Yannis (1984). The Informational Revolution, Cybernetics and Urban Modelling, PhD Thesis. University of Newcastle upon Tyne, UK.
5. ^ Veneris, Yannis (1990). "Modeling the transition from the Industrial to the Informational Revolution". Environment and Planning A 22 (3): 399-416. doi:10.1068/a220399.
External links
- The Diffusion Simulation Game, about adopting an innovation in education
- The Pencil Metaphor on diffusion of innovation particularly ICT in education
Retrieved from "http://en.wikipedia.org/wiki/Diffusion_of_innovations"
Categories: Innovation | Diffusion | Marketing | Product management | Anthropology | Memetics | Books about public opinion
Everett Rogers
From Wikipedia, the free encyclopedia
Jump to: navigation, search
Everett M. Rogers (March 6, 1931 - October 21, 2004), communications scholar, pioneer of diffusion of innovations theory, writer, and teacher. He is best known for his 'diffusion of innovations' theory and introducing the term 'early adopter.'
Early life
Rogers was born on the family Pinehurst Farm in Carroll, Iowa, in 1931. His father loved electromechanical farm innovations, but was highly resistant to biological–chemical innovations, so he resisted adopting the new hybrid seed corn, even though it yielded 25% more crop and was resistant to drought. During the Iowa drought of 1936, while the hybrid seed corn stood tall on the neighbor’s farm, however, the crop on the Rogers’ farm wilted. Rogers’ father was finally convinced.
Rogers had no plans to attend university until a school teacher drove him and some classmates to Ames to visit Iowa State University. Rogers decided to pursue a degree in agriculture there. He then served in the Korean War for two years. He returned to Iowa State University to earn a Ph.D. in sociology and statistics in 1957.
Academic research
Iowa State University in those years (the 1950s) had a great intellectual tradition in agriculture and in rural sociology. Numerous agricultural innovations were generated by scientists at land grant universities and at the U.S. Department of Agriculture. Rural sociologists, including Rogers’ doctoral advisor George Beal, were conducting pioneering studies on the diffusion of these innovations, like the high-yielding hybrid seed corn, chemical fertilizers, and weed sprays. Questions were being asked about why some farmers adopted these innovations while others did not, and also about why it takes such a long time for these seemingly advantageous innovations to diffuse.
These questions about innovation diffusion, including the strong resistances and how they could be overcome, formed the core of Rogers' graduate work at ISU. His doctoral dissertation was a study of the diffusion of weed spray, and involved interviewing more than 200 farmers about their adoption decisions.
He also reviewed existing studies of the diffusion of all kinds of innovations—agricultural,educational, medical, marketing, and so on. He found several similarities in these diverse studies. For instance, innovations tend to diffuse following an S-curve of adoption.
In 1962, Rogers publishes this review of literature chapter, greatly expanded, enhanced, and refined, as the now-legendary book Diffusion of Innovations. The book provided a comprehensive theory of how innovations diffused, or spread, in a social system. The book’s appeal was global. Its timing was uncanny. National governments in countries of Asia, Africa, and Latin America were wrestling with how to diffuse agricultural, family planning, and other social change innovations in their newly independent countries. Here was a theory that was useful.
Rogers published 30 books, translated into 15 languages, and more than 500 articles, in a 47-year academic career. He taught at Ohio State University, National University of Colombia, Michigan State University, University of Michigan, Stanford University, Universite de Paris, University of Southern California, and the University of New Mexico. In total, he taught at six US universities and six universities in Europe, the Far East, and Latin America. He taught or conducted research in Colombia, Brazil, Ecuador, France, Germany, India, Korea, Thailand, Mexico, Nigeria, and Tanzania.
Diffusion of Innovations
When the first edition (1962) of Diffusion of Innovations was published, Rogers was an assistant professor of rural sociology at Ohio State University. He was only 30 years old but was becoming a world-renowned academic figure. In the mid-2000s, The Diffusion of Innovations is the second-most-cited book in the social sciences.
Rogers proposes that adopters of any new innovation or idea can be categorized as innovators (2.5%), early adopters (13.5%), early majority (34%), late majority (34%) and laggards (16%), based on the mathematically-based Bell curve. These categories, based on standard deviations from the mean of the normal curve, provide a common language for innovation researchers. Each adopter's willingness and ability to adopt an innovation depends on their awareness, interest, evaluation, trial, and adoption. People can fall into different categories for different innovations -- a farmer might be an early adopter mechanical innovations, but a late majority adopter of biological innovations or VCRs.
When graphed, the rate of adoption formed what came to typify the DOI model, an “s-shaped curve.” (S curve) The graph essentially shows a cumulative percentage of adopters over time – slow at the start, more rapid as adoption increases, then leveling off until only a small percentage of laggards have not adopted. (Rogers Diffusion Of Innovations 1983)
His research and work became widely accepted in communications and technology adoption studies, and also found its way into a variety of other social science studies. Geoffrey Moore's Crossing the Chasm drew from Rogers in explaining how and why technology companies succeed. Rogers was also able to relate his communications research to practical health problems, including hygiene, family planning, cancer prevention, and drunk driving.
Entertainment Education
In the early 1990s Rogers turned his attention to the field of Entertainment-Education. With funding from Population Communications International[1] he evaluated a radio drama designed to improve public health in Tanzania called Twende na Wakati (Let’s Go With the Times). [2] With Arvind Singhal of Ohio University he co-wrote Entertainment Education: A Communication Strategy for Social Change.
To commemorate his contributions to the field, the University of Southern California Annenberg Norman Lear Center established the Everett M. Rogers Award for Achievement in Entertainment-Education, which recognizes outstanding practice or research in the field of entertainment education. [3]
Later life
In 1995, Rogers moved to the University of New Mexico, having become fond of Albuquerque while stationed at an airbase during the Korean War. He helped UNM launch a doctoral program in communication. He was Distinguished Professor Emeritus at UNM.
Rogers suffered from kidney disease and retired from UNM in the summer of 2004. He died just a few months later, survived by his wife, Dr. Corinne Shefner-Rogers, and two sons: David Rogers and Everett King.
See also
References
- Rogers, E. M. (2008). The fourteenth paw: Growing up on an Iowa farm in the 1930s--A memoir. Singapore: AMIC.
- Rogers, E. M. (2003). Diffusion of innovations (5th ed.). New York: Free Press.
- Rogers, E. M. (1994). A history of communication study: A biographical approach. New York: Free Press.
- Rogers, E. M. (1986). Communication technology: The new media in society. New York: Free Press.
- Rogers, E. M. (1976). Communication and development: Critical perspectives. Thousand Oaks, CA: Sage.
- Rogers, E. M. (1999). Entertainment education: A communication strategy for social change. New Jersey: Lawrence Erlbaum (with Arvind Singhal, lead author).
External references
- Obituary from University of New Mexico
- The Danger of the "Early Adopter" Myth
- Journal of health communication forum
- Journal of health communication commentaries
- Journal of health communication article
Retrieved from "http://en.wikipedia.org/wiki/Everett_Rogers"
Categories: American academics | 1931 births | 2004 deaths
The Danger of the "Early Adopter" Myth
© 2005, Peter de Jager – Peter is passionate about change, how it affects both individuals and organizations and allows them to grow and prosper. To contact him, and host internal seminars on Change Management visit www.technobility.com
When we make assumptions
about what a term means, we end up applying solutions with no relationship to
reality. The term "Early Adopter" has lost all meaning in the field
of Change Management and is causing more problems than it solves. That's a
pity, because it, and the terms surrounding it, arose from good research and
when used properly can aid in our understanding of the Change Process.
Everett Rogers, in his classic tome, "Diffusion of Innovations"
examined the "adoption levels over time" curves of hundreds of
different innovations. He noticed they were mostly the standard Bell curve. He
then, for the sake of discussion, identified different sections of this curve.
The left most 2.5% of the curve he labeled as "Innovators".
The next 13.5% were tagged as "Early Adopters".
The left of centre 34% were the "Early Majority"
The right of centre 34% are the "Late Majority" followed by the last
16%, whom he saddled with the term, "Laggards"
Once he had these categories, he examined the people residing in them to see if
he could identify common denominators beyond their location on the curve. For
example: He observed that Early Adopters were perceived as opinion leaders of
the community with respect to that change/innovation.
It's important to realize these categories had a purely statistical meaning.
The Early and Late majorities make up the core 68% of the curve as defined by
the 1st standard deviation. The Early Adopters are the left portion of the 2nd
standard deviation. In other words, "Early
Adopter" as originally intended, is purely a mathematical definition based
on the adoption curve for a particular innovation1
It's also necessary to note that this adoption curve only
exists after a population has adopted a technology2.
And finally, Adoption Curves do not exist outside
the social dynamics surrounding a specific innovation3.
ie. The same population will generate different adoption curves, if any, for a
different change/innovation.
If we lose sight of these three points, we end up abusing everything that
Diffusion Theory can teach us.
1) The statement "She is an Early Adopter" is meaningless until
associated with a specific change or innovation.
I owned a PC in 1979, which defines me at least as an Early Adopter. However, I
have only just recently (July 2004) acquired a cell phone, which makes me a
Laggard of the highest order.
The point is -- there is no contradiction here. With respect to PCs I was an
Early Adopter and with respect to Cell Phones I am a Laggard. No contradiction
exists if we use the terms
properly.
Lesson: People do not fall into one Change
Adoption Category; they drift from category to category depending on the specific change/innovation.
2) The statement "13.5% of the general population are Early
Adopters" is absolutely, totally, incorrect.
This makes two related and dangerous assumptions.
a. It assumes that
the complete Adoption Curve will
exist for any change..
b. It assumes
13.5% of us will embrace any change,
Evidence of the incorrectness of this statement is found in two casual
observations;
a) At the height of the
Hula Hoop craze, not everyone was
hula-hooping.
b) Not even 2.5% of the population have bought a Segway.
Lesson: The
adoption terms are accurate only in
hindsight; they tell you nothing about how a population might respond to a change/innovation.
"Early Adopter" and the other descriptors Rogers used to sub-divide
the Adoption Curve are post facto definitions.
They are applicable only after the
population in question has embraced a change/innovation. Just because people
take to a change/innovation before others does not mean they are "opinion leaders", that is only true if everyone else has followed their lead. Until
this happens they are merely "first to adopt" and if no-one else
follows them, then a more correct label might be "Gullible" and not
"Early Adopter".
Logistic function

![]()
Standard logistic sigmoid function
A logistic function or logistic curve is the most common sigmoid curve. It models the S-curve of growth of some set[1] P, where P might be thought of as population. The initial stage of growth is approximately exponential; then, as saturation begins, the growth slows, and at maturity, growth stops.
A simple[2] logistic function may be defined by the formula
![]()
where the
variable[3] P might be considered to denote a population and the variable t might be thought of as time. If we now let t range over the real
numbers from ![]() to
to ![]() then we obtain the S-curve
shown. In practice, due to the nature of the exponential function e − t, it is sufficient to compute t over a small range of
real numbers such as [ − 6, + 6].
then we obtain the S-curve
shown. In practice, due to the nature of the exponential function e − t, it is sufficient to compute t over a small range of
real numbers such as [ − 6, + 6].
The logistic function finds applications in a range of fields, including artificial neural networks, biology, biomathematics, demography, economics, chemistry, mathematical psychology, probability, sociology and statistics.
Bass diffusion model

The Bass diffusion model was developed by Frank Bass and describes the process of how new products get adopted as an interaction between users and potential users. It has been described as one of the most famous empirical generalisations in marketing, along with the Dirichlet model of repeat buying and brand choice [1]. The model is widely used in forecasting, especially product forecasting and technology forecasting. Mathematically, the basic Bass diffusion is a Riccati equation with constant coefficients.
Frank Bass published his paper "A new product growth model for consumer durables" in 1969. [2] Prior to this, Everett Rogers published Diffusion of Innovations, a highly influential work that described the different stages of product adoption. Bass contributed some mathematical ideas to the concept. [3]
This model has been widely influential in marketing and management science. In 2004 it was selected as one of the ten most frequently cited papers in the 50-year history of Management Science [4]. It was ranked number five, and the only marketing paper in the list. It was subsequently reprinted in the December 2004 issue of Management Science.[4]


Relationship with other s-curves
There are two special cases of the Bass diffusion model.
- The first special case occurs when q=0, when the model reduces to the Exponential distribution.
- The second special case reduces to the logistic distribution, when p=0.
The Bass model is a special case of the Gamma/shifted Gompertz distribution (G/SG).
Use in online social networks The rapid, recent (as of early 2007) growth in online social networks (and other virtual communities) has led to an increased use of the Bass diffusion model. The Bass diffusion model is used to estimate the size and growth rate of these social networks.
Development communication
Development Communication, simply defined, is the use of communication to promote social development. More specifically, it refers to the practice of systematically applying the processes, strategies, and principles of communication to bring about positive social change.[1]
The practice of development communication can be traced back to efforts undertaken in various parts of the world during the 1940s, but the widespread application of the concept came about because of the problems that arose in the aftermath of World War II . The rise of the communication sciences in the 1950s saw a recognition of the field as an academic discipline, with Daniel Lerner, Wilbur Schramm, and Everett Rogers being the earliest influential advocates. The term "Development Communication" was first coined in 1972 by Nora C. Quebral, who defines the field as
"the art and science of human communication linked to a society's planned transformation from a state of poverty to one of dynamic socio-economic growth that makes for greater equity and the larger unfolding of individual potential."[2]
The theory and practice of development communication continues to evolve today, with different approaches and perspectives unique to the varied development contexts the field has grown in.[3]
Development communication is characterized by conceptual flexibility and diversity of communication techniques used to address the problem. Some approaches in the “tool kit” of the field include: information dissemination and education, behavior change, social marketing, social mobilization, media advocacy, communication for social change, and participatory development communication.
History of the field
The theories and practices of development communication sprang from the many challenges and opportunities that faced development oriented institutions in the last century. And since these institutions existed in different contexts, different schools of development communication have arisen in different places over time.[3]
Manyozo (2006) suggests that the history field can be broken down into those of six different schools of development communication, with the Bretton Woods school being the dominant paradigm in international literature, and the other schools being the Latin American, Indian, Los Baños, African,and the participatory development communication schools.
The growing interest for these kind of applications is also reflected in the work of the World Bank, which is very active in promoting this field through its Development Communication division and recently (June 2008) published the Development Communication Sourcebook, a resource addressing the history, concepts and practical applications in this discipline.
Lazy User Model
Lazy User Model of Solution Selection (LUM) is a new model[1] (2007) that tries to explain how an individual selects a solution to fulfill a need from a set of possible solution alternatives. Lazy user model expects that a solution is selected from a set of available solutions based on the amount of effort the solutions require from the user - the user is supposed to select the solution that carries the least effort. The model is applicable to a number of different types of situations, but it can be said to be closely related to technology acceptance models.
The model draws from earlier works on how least effort affects human behaviour in information seeking[2] and in scaling of language.[3]
Earlier research within the discipline of information systems especially within the topic of technology acceptance and technology adoption is closely related to the lazy user model.
The model structure
The model starts from the observation that there is a user need, i.e. it is expected that there is a “clearly definiable, fully satisfiable want” that the user want’s satisfied (it can also said that the user has a problem and she wants the problem solved). So there is a place for a solution / product / service.
The user need defines the set of possible solutions (products, service etc.) that fulfill the user need. The basic model considers for simplicity needs that are 100% satisfiable and services that 100% satisfy the needs. This means that only the solutions that solve the problem are relevant. This logically means that the need defines the possible satisfying solutions - a set of solutions (many different products / services) that all can fulfill the user need. LUM is not limited to looking at one solution separately.
All of the solutions in the set that fulfill the need have their own characteristics; some are good and suitable for the user, others unsuitable and unacceptable – for example a if the user is in a train and want’s to know what the result from a tennis match is right now, she may only use the types of solutions to the problem that are available to her => the user state determines the set of available / suitable solutions for the user and thus limits the (available) set of possible solutions to fulfill the user need. The user state is a very wide concept, it is the user characteristics at the time of the need. The user state includes, e.g., age, wealth, location... everything that determines the state of the user in relation with the solutions in the set of the possible solutions to fulfill the user need.
The model supposes that after the user need has defined the set of possible solutions that fulfill the user need and the user state has limited the set to the available plausible solutions that fulfill the user need the user will select a solution from the set to fulfill the need. Obviously if the set is empty the user does not have a way to fulfill the need. The lazy user model assumes that the user will make the selection from the limited set based on the lowest level of effort. Effort is understood as the combination of monetary cost + time needed + physical / mental effort needed.[4]
See the Lazy User Model Homepage for a graphical presentation of the model structure.
Normalization Process Theory
Normalization Process Theory is a sociological theory of the implementation, embedding, and integration of new technologies and organizational innovations developed by Carl R. May and Tracey Finch. [1] [2] [3]
It builds on the earlier work of May and his co-researchers, who initially developed a Normalization Process Model to explain the social processes that lead to the routine embedding of innovative health technologies. [4] [5] Normalization Process Theory radically extends the scope of the model. However, it retains its focus on agency and incorporates its constructs of Collective Action (the work that people do to enact a new technology) as one of four social mechanisms that are postulated to drive implementation processes.
Normalization Process Theory is a true middle range theory that appears to be compatible with theories of the transmission and organization of innovations, especially diffusion of innovations theory, labor process theory, and psychological social learning theory. Applied to science and technology studies, or STS, it appears to be a straightforward alternative to actor-network theory (it does not insist on the agency of non-human actors, and seeks to be explanatory, not descriptive). It appears to lend itself equally to both ethnography and survey research methods.
Normalization Process Theory is framed by three postulates.
P1. Material practices become routinely embedded in social contexts as the result of individual and collective agency. From this follow specific propositions that define a mechanism (i.e. embedding is dependent on socially patterned implementation work).
P2. The work of embedding is operationalized through four generative mechanisms (coherence; cognitive participation; collective action; reflexive monitoring). From this follows specific propositions that define components of a mechanism (i.e. those factors that shape socially patterned implementation work). Generative mechanisms are defined thus:
- Coherence (or sense-making): expressed agency that defines and organizes the components of an implementation process.
- Cognitive Participation: expressed agency that defines and organizes the actors involved in an implementation process.
- Collective Action: expressed agency that defines and organizes the enacting of an implementation process.
- Reflexive Monitoring: expressed agency that defines and organizes assessment of the outcomes of a complex intervention. '
P3. The production and reproduction of a material practice requires continuous investment by agents in ensembles of action that carry forward in time and space. From this follow specific propositions that define actors’ investments in a mechanism (i.e. how the mechanism is energized).
Technology lifecycle
From Wikipedia, the free encyclopedia
Jump to: navigation, search
Most new technologies follow a similar technology maturity lifecycle describing the technological maturity of a product. This is not similar to a product life cycle, but applies to an entire technology, or a generation of a technology.
Technology adoption is the most common phenomenon driving the evolution of industries along the industry lifecycle. After expanding new uses of resources they end with exhausting the efficiency of those processes, producing gains that are first easier and larger over time then exhaustingly more difficult.
Technology perception dynamics
There is usually technology hype at the introduction of any new technology, but only after some time has passed can it be judged as mere hype or justified true acclaim. Because of the logistic curve nature of technology adoption, it is difficult to see in the early stages whether the hype is excessive.
The two errors commonly committed in the early stages of a technology's development are[citation needed]:
- fitting an exponential curve to the first part of the growth curve, and assuming eternal exponential growth
- fitting a linear curve to the first part of the growth curve, and assuming that takeup of the new technology is disappointing
Similarly, in the later stages, the opposite mistakes can be made relating to the possibilities of technology maturity and market saturation.
Technology adoption typically occurs in an S curve, as modelled in diffusion of innovations theory. This is because customers respond to new products in different ways. Diffusion of innovations theory, pioneered by Everett Rogers, posits that people have different levels of readiness for adopting new innovations and that the characteristics of a product affect overall adoption. Rogers classified individuals into five groups: innovators, early adopters, early majority, late majority, and laggards. In terms of the S curve, innovators occupy 2.5%, early adopters 13.5%, early majority 34%, late majority 34%, and laggards 16%.
Stages
From a layman's perspective, the technological maturity can be broken down into five distinct stages.
1. Bleeding edge - any technology that shows high potential but hasn't demonstrated its value or settled down into any kind of consensus. Early adopters may win big, or may be stuck with a white elephant.
2. Leading edge - a technology that has proven itself in the marketplace but is still new enough that it may be difficult to find knowledgeable personnel to implement or support it.
3. State of the art - when everyone agrees that a particular technology is the right solution.
4. Dated - still useful, still sometimes implemented, but a replacement leading edge technology is readily available.
5. Obsolete - has been superseded by state-of-the-art technology, maintained but no longer implemented.
See also
- Configuration System
- Diffusion
- Diffusion of Innovations
- Disruptive technology
- Everett Rogers
- Industry lifecycle
- Mature technology
- Network effects
- New product development
- Product management
- Product life cycle management
- Technology acceptance model
- Technology Adoption LifeCycle
- Toolkits for User Innovation
- Tipping point
Tipping point (sociology)
From Wikipedia, the free encyclopedia
Jump to: navigation, search
For other uses, see Tipping point (disambiguation).
In sociology, a tipping point or angle of repose is the event of a previously rare phenomenon becoming rapidly and dramatically more common. The phrase was coined in its sociological use by Morton Grodzins, by analogy with the fact in physics that adding a small amount of weight to a balanced object can cause it to suddenly and completely topple.
Grodzins studied integrating American neighborhoods in the early 1960s. He discovered that most of the white families remained in the neighborhood as long as the comparative number of black families remained very small. But, at a certain point, when "one too many" black families arrived, the remaining white families would move out en masse in a process known as white flight. He called that moment the "tipping point". The idea was expanded and built upon by Nobel Prize-winner Thomas Schelling in 1972. A similar idea underlies Mark Granovetter's threshold model of collective behavior.
Other uses
The phrase has extended beyond its original meaning and been applied to any process in which, beyond a certain point, the rate at which the process proceeds increases dramatically. It has been applied in many fields, from economics to human ecology[1] to epidemiology. It can also be compared to phase transition in physics or the propagation of populations in an unbalanced ecosystem.
Mathematically, the angle of repose may be seen as an inflection point. In control theory, the concept of positive feedback describes the same phenomenon, with the problem of balancing an inverted pendulum being the classic embodiment. The concept has also been applied to the popular acceptance of new technologies, for example being used to explain the success of VHS over Betamax.[citation needed]
In popular culture
The term was popularized in application to daily life by Malcolm Gladwell's 2000 bestselling book The Tipping Point: How Little Things Can Make a Big Difference.
Angle of repose
From Wikipedia, the free encyclopedia
Jump to: navigation, search

![]()
Angle of repose
For the Wallace Stegner novel, see Angle of Repose (novel).
For the friction angle between two solid objects, see Friction angle.
The angle of repose (sometimes incorrectly confused with the 'Angle of Internal Friction') is an engineering property of granular materials. The angle of repose is the maximum angle of a stable slope determined by friction, cohesion and the shapes of the particles.
When bulk granular materials are poured onto a horizontal surface, a conical pile will form. The internal angle between the surface of the pile and the horizontal surface is known as the angle of repose and is related to the density, surface area, and coefficient of friction of the material. Material with a low angle of repose forms flatter piles than material with a high angle of repose. In other words, the angle of repose is the angle a pile forms with the ground.
Applications of theory
The angle of repose is sometimes used in the design of equipment for the processing of particulate solids. For example, it may be used to design an appropriate hopper or silo to store the material. It can also be used to size a conveyor belt for transporting the material. It can also be used in determining whether or not a slope (of a stockpile, or uncompacted gravel bank, for example) will likely collapse; the talus slope is derived from angle of repose and represents the steepest slope a pile of granular material will take. This angle of repose is also crucial in determining the correct calculus of stability in vessels.
It is also commonly used by mountaineers as a factor in analyzing avalanche danger in alpine areas.
Measurement
There are numerous methods for measuring angle of repose and each produces slightly different results. Results are also sensitive to the exact methodology of the experimenter. As a result, data from different labs is not always comparable.
An alternative measurement, useful for many of the same purposes, is testing with a specialized instrument called a shear cell.
Exploitation by antlion larvae

![]()
Sand pit trap of the antlion
The larva of the antlion traps small insects such as ants by digging a conical pit in loose sand, such that the slope of the walls is very close to the angle of repose for the sand.[1] Thus, when a small insect blunders into the pit, its weight causes the sand to collapse below it, drawing the ant toward the center where the antlion larva lies in wait. The antlion larva assists this process by vigorously flicking sand out from the center of the pit when it detects a disturbance, undermining the pit walls and causing them to collapse toward the center, bringing the prey with them.
Catastrophe theory
In mathematics, catastrophe theory is a branch of bifurcation theory in the study of dynamical systems; it is also a particular special case of more general singularity theory in geometry.
Bifurcation theory studies and classifies phenomena characterized by sudden shifts in behavior arising from small changes in circumstances, analysing how the qualitative nature of equation solutions depends on the parameters that appear in the equation. This may lead to sudden and dramatic changes, for example the unpredictable timing and magnitude of a landslide.
Catastrophe theory, which originated with the work of the French mathematician René Thom in the 1960s, and became very popular due to the efforts of Christopher Zeeman in the 1970s, considers the special case where the long-run stable equilibrium can be identified with the minimum of a smooth, well-defined potential function (Lyapunov function).
Small changes in certain parameters of a nonlinear system can cause equilibria to appear or disappear, or to change from attracting to repelling and vice versa, leading to large and sudden changes of the behaviour of the system. However, examined in a larger parameter space, catastrophe theory reveals that such bifurcation points tend to occur as part of well-defined qualitative geometrical structures.
Hundredth Monkey Effect
From Wikipedia, the free encyclopedia
Jump to: navigation, search
The “Hundredth Monkey Effect” is a supposed phenomenon in which a learned behaviour spreads instantaneously from one group of monkeys to all related monkeys once a critical number is reached. By generalisation it means the instant, paranormal spreading of an idea or ability to the remainder of a population once a certain portion of that population has heard of the new idea or learned the new ability. The story behind this supposed phenomenon originated with Lawrence Blair and Lyall Watson, who claimed that it was the observation of Japanese scientists. One of the primary factors in the promulgation of the myth is that many authors quote secondary, tertiary or post-tertiary sources who have themselves misrepresented the original observations.
Popularization of the claim
The story of the “Hundredth Monkey Effect” was published in the foreword to Lawrence Blair's Rhythms of Vision in 1975.[1] The claim spread with the appearance of Lifetide, a 1979 book by Lyall Watson. In it, Watson repeats Blair's claim. The authors describe similar scenarios. They state that unidentified scientists were conducting a study of macaques monkeys on the Japanese island of Koshima in 1952.[2] These scientists purportedly observed that some of these monkeys learned to wash sweet potatoes, and gradually this new behavior spread through the younger generation of monkeys—in the usual fashion, through observation and repetition. Watson then claimed that the researchers observed that once a critical number of monkeys was reached—the so-called hundredth monkey—this previously learned behavior instantly spread across the water to monkeys on nearby islands.
This story was further popularized by Ken Keyes, Jr. with the publication of his book The Hundredth Monkey. Keyes presented the “Hundredth Monkey Effect” story as an inspirational parable, applying it to human society and the effecting of positive change therein. Since then, the story has become widely accepted as fact and even appears in books written by some educators.
The content of the book by Keyes was a substantive treatise on the effects of nuclear war on the planet and the devastation caused thereon. This idea has been debunked in several double-blind studies and major universities.[citation needed]
The original research
In 1985, Elaine Myers re-examined the original published research in “The Hundredth Monkey Revisited” in the journal In Context. In her review she found that the original research reports by the Japan Monkey Center in Vol. 2, 5, and 6 of the journal Primates are insufficient to support Watson’s story. In short, she is suspicious of the existence of “Hundredth Monkey” phenomenon; the published articles describe how the sweet potato washing behavior gradually spread through the monkey troop and became part of the set of learned behaviors of young monkeys, but she doesn’t agree that it can serve as an evidence for the existence of a critical number at which the idea suddenly spread to other islands.
However, the story as told by Watson and Keyes is popular among New Age authors and personal growth gurus and has become an urban legend and part of New Age mythology. Also, Rupert Sheldrake has cited that a phenomenon like the "Hundredth Monkey Effect" would be an evidence of Morphic fields bringing about non-local effects in consciousness and learning. As a result, the story has also become a favorite target of the Committee for the Scientific Investigation of Claims of the Paranormal and was used as the title essay in The Hundredth Monkey: And Other Paradigms of the Paranormal published by them in 1991.
In his book Why People Believe Weird Things, Michael Shermer explains how the urban legend started, was popularised, and has been discredited.
The effect discredited
An analysis of the appropriate literature by Ron Amundson, published by the Skeptics Society, revealed several key points that demystified the supposed effect.
Unsubstantiated claims that there was a sudden and remarkable increase in the proportion of washers in the first population were exaggerations of a much slower, more mundane effect. Rather than all monkeys mysteriously learning the skill it was noted that it was predominantly younger monkeys that learned the skill from the older monkeys through the usual means of imitation; older monkeys who did not know how to wash tended not to learn. As the older monkeys died and younger monkeys were born the proportion of washers naturally increased. The time span between observations were in the order of years.
Claims that the practice spread suddenly to other isolated populations of monkeys ignore the fact that at least one washing monkey swam to another population and spent about four years there.[citation needed] It is also to be noted that the sweet potato was not available to the monkeys prior to human intervention: it is not at all surprising that isolated populations of monkeys started to wash potatoes in a similar time frame once they were made available.
Cultural references
This phenomenon is referenced in the comic Y: The Last Man and is suggested to be related to the phenomenon that is at the core of the series (the sudden, simultaneous death of almost every male mammal on the planet).
Karl Pilkington mentioned it in one of his monkey news items on the Ricky Gervais Show, XFM, on the 16th of August 2003.
Network effect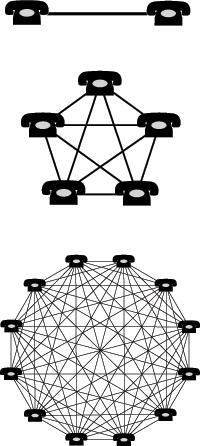

In economics and business, a network effect (also called network externality) is the effect that one user of a good or service has on the value of that product to other people.
The classic example is the telephone. The more people own telephones, the more valuable the telephone is to each owner. This creates a positive externality because a user may purchase their phone without intending to create value for other users, but does so in any case.
The expression "network effect" is applied most commonly to positive network externalities as in the case of the telephone. Negative network externalities can also occur, where more users make a product less valuable, but are more commonly referred to as "congestion" (as in traffic congestion or network congestion).
Over time, positive network effects can create a bandwagon effect as the network becomes more valuable and more people join, in a positive feedback loop.
Origins
Network effects were a central theme in the arguments of Theodore Vail, the first post patent president of Bell Telephone, in gaining a monopoly on telephone services. In 1908, when he presented the concept in Bell's annual report, there were over 4000 local and regional telephone exchanges, most of which were eventually merged into the Bell System. The economics of network effects were presented in a paper by Bell employee N. Lytkins in 1917, where the term network externality was used.[citation needed]
Network effects were more recently popularized by Robert Metcalfe, the founder of Ethernet. In selling the product, Metcalfe argued that customers needed Ethernet cards to grow above a certain critical mass if they were to reap the benefits of their network. [1]
According to Metcalfe, the rationale behind the sale of networking cards was that (1) the cost of cards was proportional to the number of cards installed, but (2) the value of the network was proportional to the square of the number of users. This was expressed algebraically as having a cost of N, and a value of N². While the actual numbers behind this definition were never firm, the concept allowed customers to share access to expensive resources like disk drives and printers, send e-mail, and access the internet.
Benefits
Network effects become significant after a certain subscription percentage has been achieved, called critical mass. At the critical mass point, the value obtained from the good or service is greater than or equal to the price paid for the good or service. As the value of the good is determined by the user base, this implies that after a certain number of people have subscribed to the service or purchased the good, additional people will subscribe to the service or purchase the good due to the positive utility:price ratio.
A key business concern must then be how to attract users prior to reaching critical mass. One way is to rely on extrinsic motivation, such as a payment, a fee waiver, or a request for friends to sign up. A more natural strategy is to build a system that has enough value without network effects, at least to early adopters. Then, as the number of users increases, the system becomes even more valuable and is able to attract a wider user base. Joshua Schachter has explained that he built Del.icio.us along these lines - he built an online system where he could keep bookmarks for himself, such that even if no other user joined, it would still be valuable to him.[2] It was relatively easy to build up a user base from zero because early adopters found enough value in the system outside of the network aspects. The same could be said for many other successful websites which derive value from network effects, e.g. Flickr, MySpace.
Beyond critical mass, the increasing number of subscribers generally cannot continue indefinitely. After a certain point, most networks become either congested or saturated, stopping future uptake. Congestion occurs due to overuse. The applicable analogy is that of a telephone network. While the number of users is below the congestion point, each additional user adds additional value to every other customer. However, at some point the addition of an extra user exceeds the capacity of the existing system. After this point, each additional user decreases the value obtained by every other user. In practical terms, each additional user increases the total system load, leading to busy signals, the inability to get a dial tone, and poor customer support. The next critical point is where the value obtained again equals the price paid. The network will cease to grow at this point, and the system must be enlarged. The congestion point may be larger than the market size. New Peer-to-peer technological models may always defy congestion. Peer-to-Peer systems, or "P2P," are networks designed to distribute load among their user pool. This theoretically allows true P2P networks to scale indefinitely. The P2P based telephony service Skype benefits greatly from this effect. But market saturation will still occur.
Network effects are commonly mistaken for economies of scale, which result from business size rather than interoperability (see also natural monopoly). To help clarify the distinction, people speak of demand side vs. supply side economies of scale. Classical economies of scale are on the production side, while network effects arise on the demand side. Network effects are also mistaken for economies of scope.
The network effect has a lot of similarities with the description of phenomenon in reinforcing positive feedback loops description of system dynamics (Sterman 2000). System dynamics could be used as a modeling method to describe such phenomenon such as word of mouth and Bass model of marketing.
Business examples
Financial exchanges
Stock exchanges and derivatives exchanges feature a network effect. Market liquidity is a major determinant of transaction cost in the sale or purchase of a security, as a bid-ask spread exists between the price at which a purchase can be done versus the price at which the sale of the same security can be done. As the number of buyers and sellers on an exchange increases, liquidity increases, and transaction costs decrease. This then attracts a larger number of buyers and sellers to the exchange. See, for example, the work of Steve Wunsch (1999).[3]
The network advantage of financial exchanges is apparent in the difficulty that startup exchanges have in dislodging a dominant exchange. For example, the Chicago Board of Trade has retained overwhelming dominance of trading in US Treasury Bond futures despite the startup of Eurex US trading of identical futures contracts. Similarly, the Chicago Mercantile Exchange has maintained a dominance in trading of Eurobond interest rate futures despite a challenge from Euronext.Liffe.
Software
There are very strong network effects operating in the market for widely used computer software.
Take for example Microsoft Office. For many people choosing an office suite, prime considerations include how valuable having learned that office suite will prove to potential employers, and how well the software interoperates with other users. That is, since learning to use an office suite takes many hours, they want to invest that time learning the office suite that will make them most attractive to potential employers (or consulting clients, etc), and they also want to be able to share documents. (Additionally, an example of an indirect network effect in this case is the notable similarity in user-interfaces and operability menus of most new software - since that similarity directly translates into less time spent learning new environments, therefore potentially greater acceptance and adoption of those products.)
Similarly, finding already-trained employees is a big concern for employers when deciding which office suite to purchase or standardize on. The lack of cross-platform user-interface standards results in a situation in which one firm is in control of almost 100% of the market.
Microsoft Windows is a further example of network effect. The most-vaunted advantage of Windows, and that most publicised by Microsoft, is that Windows is compatible with the widest range of hardware and software. Although this claim was justified at some point of time, it was in reality the result of network effect: hardware and software manufacturers ensure that their products are compatible with Windows in order to have access to the large market of Windows users. Thus, Windows is popular because it is well supported, but is well supported because it is popular. However, network effects need not lead to market dominance by one firm, when there are standards which allow multiple firms to interoperate, thus allowing the network externalities to benefit the entire market. This is true for the case of x86-based personal computer hardware, in which there are extremely strong market pressures to interoperate with pre-existing standards, but in which no one firm dominates in the market. The same holds true for the market for long-distance telephone service within the United States. In fact, the existence of these types of networks discourages dominance of the market by one company, as it creates pressures which work against one company attempting to establish a proprietary protocol or to even distinguish itself by means of product differentiation.
In cases in which the relevant communication protocols or interfaces are closed standards the network effect can give the company controlling those standards monopoly power. The Microsoft corporation is widely seen by computer professionals as maintaining its monopoly through these means. One observed method Microsoft uses to put the network effect to its advantage is called embrace and extend (derisively called embrace, extend, and extinguish).
Mirabilis is an Israeli start-up which pioneered instant messaging (IM) and was bought by America Online. By giving away their ICQ product for free and preventing interoperability between their client software and other products, they were able to temporarily dominate the market for instant messaging. Because of the network effect, new IM users gained much more value by choosing to use the Mirabilis system (and join its large network of users) than they would using a competing system. As was typical for that era, the company never made any attempt to generate profits from their dominant position before selling the company.
Web sites
Many web sites also feature a network effect. One example is web marketplaces and exchanges, in that the value of the marketplace to a new user is proportional to the number of other users in the market. For example, eBay would not be a particularly useful site if auctions were not competitive. However, as the number of users grows on eBay, auctions grow more competitive, pushing up the prices of bids on items. This makes it more worthwhile to sell on eBay and brings more sellers onto eBay, which drives prices down again as this increases supply, while bringing more people onto eBay because there are more things being sold that people want. Essentially, as the number of users of eBay grows, prices fall and supply increases, and more and more people find the site to be useful.
The collaborative encyclopedia Wikipedia also benefits from a network effect. The theory goes that as the number of editors grows, the quality of information on the website improves, encouraging more users to turn to it as a source of information; some of the new users in turn become editors, continuing the process.
Social networking websites are also good examples. The more people register onto a social networking website, the more useful the website is to its registrants.
By contrast, the value of a news site is primarily proportional to the quality of the articles, not to the number of other people using the site. Similarly, the first generation of search sites experienced little network effect, as the value of the site was based on the value of the search results. This allowed Google to win users away from Yahoo! without much trouble, once users believed that Google's search results were superior. Some commentators mistook the value of the Yahoo! brand (which does increase as more people know of it) for a network effect protecting its advertising business.
Alexa Internet uses a technology that tracks users' surfing patterns; thus Alexa's Related Sites results improve as more users use the technology. Alexa's network relies heavily on a small number of browser software relationships, which makes the network more vulnerable to competition.
Google has also attempted to create a network effect in its advertising business with its Google AdSense service. Google AdSense places ads on many small sites, such as blogs, using Google technology to determine which ads are relevant to which blogs. Thus, the service appears to aim to serve as an exchange (or ad network) for matching many advertisers with many small sites (such as blogs). In general, the more blogs Google AdSense can reach, the more advertisers it will attract, making it the most attractive option for more blogs, and so on, making the network more valuable for all participants.
Network effects were used as justification for some of the dot-com business models in the late 1990s. These firms operated under the belief that when a new market comes into being which contains strong network effects, firms should care more about growing their market share than about becoming profitable. This was believed because market share will determine which firm can set technical and marketing standards and thus determine the basis of future competition.
Rail gauge

![]()
The dominant rail gauge in each country shown
Main article: gauge conversion
There are strong network effects in the initial choice of rail gauge, and in gauge conversion decisions. Even when placing isolated rails not connected to any other lines, track layers usually choose a standard rail gauge so they can use off-the-shelf rolling stock. Although a few manufacturers make rolling stock that can adjust to different rail gauges, most manufacturers make rolling stock that only works with one of the standard rail gauges.
Technology lifecycle
If some existing technology or company whose benefits are largely based on network effects starts to lose market share against a challenger such as a disruptive technology or open standards based competition, the benefits of network effects will reduce for the incumbent, and increase for the challenger.
In this model, a tipping point is eventually reached at which the network effects of the challenger dominate those of the former incumbent, and the incumbent is forced into an accelerating decline, whilst the challenger takes over the incumbent's former position.
Lock-in
Vendor "lock-in" or natural monopoly, can result from network effects.
Not surprisingly network economics became a hot topic after the diffusion of the Internet across academia. Most people know only of Metcalfe's law as part of network effects. Network effects are notorious for causing vendor lock-in with the most-cited examples being Microsoft products and the qwerty keyboard.
Network effects are a source of, but distinct from, lock-in. Lock-in can result from network effects, and network effects generate increasing returns that are associated with lock-in. However, the presence of a network effect does not guarantee that lock-in will result. For example, if the network standards are open, enabling competitive implementation by different vendors, there is no vendor lock-in.
Types of network effects
There are two kinds of economic value to be concerned about when thinking of network effects:
Inherent — I derive value
from my use of the product
Network — I derive value from other people's use of the product
Network value itself can be direct or indirect.
Direct network value is an immediate result of other users adopting the same system. Some examples of this are fax machines and email.
Indirect is a secondary result of many people using the same system. For example, complementary goods are cheaper or more available when many people adopt a standard. Toner may be cheaper for widely used printers. An example of this is that Windows and Linux can be seen as competing not for users, but for software developers, as shown by Nicholas Economides and Evangelos Katsamakas.
Negative and positive network effects
Positive network effects are obvious. More people means more interaction. Wikipedia itself depends on positive network effects. Negative network effects beyond lock-in also exist.
Negative network effects result from resource limits. Consider the connection that overloads the freeway — or the competition for bandwidth. In fact, the automobile and ethernet congestion examples illustrate that there can be threshold limits. In this case, the n+1 person begins to decrease the value of a network if additional resources are not provided.
The result is that in some networks there is an exclusion value. This is clear to anyone who has considered problems of authentication or trust on the modern internet.
Another negative network effect is provider complacency. The absence of viable competitors in a successful network can cause a provider to restrict resources, consider fee increases, or otherwise create an environment contrary to the users' benefit. These situations are typically accompanied by vocal complaints from the users. (In a competitive environment the users would simply change vendors rather than complain.)
Classic examples are the United States Postal Service or telephone companies during the 1960s and 1970s. More recent examples include Microsoft's operating system and eBay's auction site.
See also
- Open system (computing)
- Open standard
- Open format
- Vendor lock-in
- Path dependence
- Metcalfe's law
- Reed's law
- Betamax
- Two-sided market
- Technology lifecycle
- Business model
- Bandwagon effect
- Cluster effect
- The Long Tail
- List of management topics
- Graph Theory
- Semantic Web
- Returns to scale (increasing returns)
References
1. ^ It's All In Your Head - Forbes.com
2. ^ "TR35 2006 Young Innovator: Joshua Schachter, 32 (Del.icio.us [Yahoo)]". Technology Review. 2006. http://www.technologyreview.com/tr35/Profile.aspx?Cand=T&TRID=432. Retrieved on 2008-03-20. ""For a system to be successful, the users of the system have to perceive that it's directly valuable to them," Schachter says. "If you need scale in order to create value, it's hard to get scale, because there's little incentive for the first people to use the product. Ideally, the system should be useful for user number one."".
3. ^ Wunsch, Steve (1999). "Mayday, Mayday"
External links
- Coordination and Lock-In: Competition with Switching Costs and Network Effects, Joseph Farrell and Paul Klemperer.
- Network Externalities (Effects), S. J. Liebowitz, Stephen E. Margolis.
- An Overview of Network Effects, Arun Sundararajan.
- The Economics of Networks, Nicholas Economides.
Retrieved from "http://en.wikipedia.org/wiki/Network_effect"
Categories: Economics effects | Business models | Networks | Transport economics | Monopoly (economics)
Hidden categories: Articles needing additional references from May 2008 | All articles with unsourced statements | Articles with unsourced statements since August 2008 | Articles needing additional references from March 2008 | Articles needing additional references | Cleanup from December 2008 | All pages needing cleanup
Path-dependence explains how the set of decisions one faces for any given circumstance is limited by the decisions one has made in the past, even though past circumstances may no longer be relevant.[1]
The phrase is regularly used to mean one of two things (Pierson 2004):
- Some authors use path-dependence to mean simply "history matters" - a broad concept;
- Others use it to mean that institutions are self reinforcing - a narrow concept.
It is the narrow concept that has the most explanatory force and of which the discussions below are examples. The claim "history matters" is trivially true and reduces simply to "everything has causes".
…Consider as an example the technological development of videocassette recorders (VCRs) for home use. It is argued that management errors and minor design choices by Sony was one of the reasons why its Betamax format was defeated in market competition by VHS in the 1980s. Two mechanisms can explain why the small but early lead gained by VHS became larger over time. The first is the bandwagon effect of VCR manufacturers in favor of the VHS format in the U.S. and Europe, who switched because they expected VHS to win the standards battle. The second was a network effect: videocassette rental stores observed that more people had VHS players and stocked up on VHS tapes; this in turn led other people to buy VHS players, and so on until there was complete vendor lock-in to VHS. An alternative explanation, of course, is that VHS was better adapted to market demands (in particular to the demand for longer cassettes for recording sports games) and that path dependence had little or nothing to do with its success. There is also some support for this latter claim.
Positive feedback mechanisms like bandwagon and network effects are at the origin of path-dependence. They lead to a reinforcing pattern, in which industries 'tip' towards one or another product design. Uncoordinated standardisation can be observed in many other situations.
Examples from economics, history, software, and biology are presented below.
Metcalfe's law
![]()
Two telephones can make only one connection, five can make 10 connections, and twelve can make 66 connections.
Metcalfe's law states that the value of a telecommunications network is proportional to the square of the number of connected users of the system (n2). First formulated in this form by George Gilder in 1993,[1] and attributed to Robert Metcalfe in regard to Ethernet, Metcalfe's law was originally presented, circa 1980, not in term of users, but rather of "compatibly communicating devices" (for example, fax machines).[2]
Metcalfe's law characterizes many of the network effects of communication technologies and networks such as the Internet, social networking, and the World Wide Web. It is related to the fact that the number of unique connections in a network of a number of nodes (n) can be expressed mathematically as the triangular number n(n − 1)/2, which is proportional to n2 asymptotically.
The law has often been illustrated using the example of fax machines: a single fax machine is useless, but the value of every fax machine increases with the total number of fax machines in the network, because the total number of people with whom each user may send and receive documents increases.
Metcalfe's law is more of a heuristic or metaphor than an iron-clad empirical rule. In addition to the difficulty of quantifying the "value" of a network, the mathematical justification measures only the potential number of contacts, i.e., the technological side of a network. However the social utility of a network depends upon the number of nodes in contact. For instance, if Chinese and non-Chinese users don't understand each other, the utility of a network of users that speak the other language is near zero, and the law has to be calculated for the two sub-networks separately.
See also
- The generalized Network effect of microeconomics.
- Reed's law
- Sarnoff's law
- List of eponymous laws
Reed's law
From Wikipedia, the free encyclopedia
Jump to: navigation, search
Reed's law is the assertion of David P. Reed that the utility of large networks, particularly social networks, can scale exponentially with the size of the network.
The reason for
this is that the number of possible sub-groups of network participants is ![]() , where N is the number of participants. This grows much more rapidly than either
, where N is the number of participants. This grows much more rapidly than either
- the number of participants, N, or
- the number of possible pair
connections,
 (which follows Metcalfe's
law)
(which follows Metcalfe's
law)
so that even if the utility of groups available to be joined is very small on a peer-group basis, eventually the network effect of potential group membership can dominate the overall economics of the system.
http://www.reed.com/gfn/docs/reedslaw.html
That Sneaky Exponential—Beyond Metcalfe's Law to the Power of Community Building
by David P. Reed (http://www.reed.com/contactinfo)
[Note: an earlier
version of this essay was prepared as an online supplement to an article in Context magazine published in Spring
1999]
Bob Metcalfe, inventor of the Ethernet, is known for pointing out that the
total value of a communications network grows with the square of the number of
devices or people it connects. This scaling law, along with Moore's Law, is
widely credited as the stimulus that has driven the stunning growth of Internet
connectivity. Because Metcalfe's law implies value grows faster than does the
(linear) number of a network's access points, merely interconnecting two
independent networks creates value that substantially exceeds the original
value of the unconnected networks. Thus the growth of Internet connectivity,
and the openness of the Internet, are driven by an inexorable economic logic,
just as the interconnection of the telephone network was forced by AT&T's
long distance strategy. This strategy created huge and increasing value to
AT&T customers, based on the same (then unnamed) law of increasing returns
to scale at the beginning of the 20th century. In the same way, the global
interconnection of networks we call the Internet has created huge and
increasing value to all its participants.
http://www.contextmag.com/setFrameRedirect.asp?src=/archives/199903/digitalstrategy.asp
 Conventional wisdom is that a remarkably powerful effect known as
Metcalfe's Law is driving the growth of the Internet. The law says that the
value of a network grows in proportion to the square of the number of users,
which means that, once a network achieves a certain size, it becomes almost
irresistibly attractive. But Metcalfe's Law actually understates the potential
value of the Internet, and by a huge margin.
Conventional wisdom is that a remarkably powerful effect known as
Metcalfe's Law is driving the growth of the Internet. The law says that the
value of a network grows in proportion to the square of the number of users,
which means that, once a network achieves a certain size, it becomes almost
irresistibly attractive. But Metcalfe's Law actually understates the potential
value of the Internet, and by a huge margin.
I'd like to suggest a new way of looking at the economics of the Internet. I think my approach can explain why forecasters have so consistently underestimated its growth. (And, believe me, they have: In 1995, estimates for on-line commerce in 1998 were $2 billion to $3 billion, while the real number turned out to be more like $13 billion.) My approach not only should add to the urgency that businesses feel about moving on-line but also helps identify which on-line strategies will work and which will fail.
It helps to first understand the two laws of networks that have been around for some time. First is what might be called Sarnoff's Law, after the pioneer of the broadcast industry. This law says that the value of a network grows in proportion to the number of viewers.
Second is the law named after Bob Metcalfe, the inventor of the Ethernet computer-networking technology. He reasoned that 1,000 people on a network can have roughly one million different conversations, so he said the value of a network grows in proportion to the square of the number of users. The n² value explains the growth behavior of networks, such as phone systems or electronic-mail systems, that are mainly used for one-on-one communication. The n² effect says that, given the choice of joining a large existing network with many users or an incompatible new one with few users, new users will almost always decide that the bigger one is far more valuable. The result is often explosive, accelerating growth once a network establishes dominance. This behavior explains why there is now one global e-mail system, while just a few years ago there were thousands.
There's an additional law at play with the Internet because it facilitates the formation of groups, in a way that Sarnoff and Metcalfe networks do not. The number of groups that can be formed over the Internet isn't the Sarnoff n or Metcalfe n². It's 2n by the time you add up all the possible two-person groups, three-person groups, etc. So, the value of the Internet grows in proportion to 2n. Let's call this effect the Group-Forming Law.
This law is so powerful because 2n gets impossibly large very fast. There's the old story about the king who rewarded a wise minister by offering him anything he wanted. The minister said all he wished for was two copper coins on the first square of a chess board, four on the second, eight on the third, and so on—a progression based on 2n. The king protested that the minister should ask for gold or pearls, not copper. But, by the time the 8,192 coins were placed on the 13th square, the king realized he'd been had—264; is more than 18 quintillion, which, if memory serves, is more grains of sand than exist in the world. (The story has it that the king had the minister beheaded for being a wiseguy.)
All three laws, in fact, apply to the Internet. Services such as news sites that are aimed at individuals benefit from additional users in a linear, Sarnoff way. Services aimed at facilitating transactions, such as many commercial sites, benefit in an n² Metcalfe way. Services aimed at building communities, such as AOL, benefit in a 2n, Group-Forming way. What's important is that the dominant value in a typical network tends to shift from Sarnoff to Metcalfe to Group-Forming as the scale of the network increases. So, as the Internet continues to expand, investments in Group-Forming networks are likely to produce the biggest returns.
As the scale increases, what's important also shifts. When Sarnoff's Law dominates, content such as TV programs is king. When Metcalfe's Law kicks in, transactions are king. When the Group-Forming Law takes hold, communities are king. The value in a Group-Forming network is constructed jointly, whether through discussion groups, through joint plans to buy something in bulk at low prices, or through some other means.
But the theory is less important than the practice, at least if you're trying to profit from the Internet, so I'll make some predictions based on the likely effects of the Group-Forming Law: MORE
The Long Tail

![]()
An example of a power law graph being used to demonstrate ranking of popularity. To the right is the long tail, to the left are the few that dominate (also known as the 80-20 rule).
The phrase The Long Tail (as a proper noun) was first coined by Chris Anderson in an October 2004 Wired magazine article[1] to describe the niche strategy of businesses, such as Amazon.com or Netflix, that sell a large number of unique items, each in relatively small quantities.
A frequency distribution with a long tail — the concept at the root of Anderson's coinage — has been studied by statisticians since at least 1946.[2] The distribution and inventory costs of these businesses allow them to realize significant profit out of selling small volumes of hard-to-find items to many customers, instead of only selling large volumes of a reduced number of popular items. The group that purchases a large number of "non-hit" items is the demographic called the Long Tail.
Given a large enough availability of choice, a large population of customers, and negligible stocking and distribution costs, the selection and buying pattern of the population results in a power law distribution curve, or Pareto distribution. This suggests that a market with a high freedom of choice will create a certain degree of inequality by favoring the upper 20% of the items ("hits" or "head") against the other 80% ("non-hits" or "long tail").[3]
Ken McCarthy addressed this phenomenon from the media producers' point of view in 1994. Explaining that the pre-Internet media industry made its distribution and promotion decisions based on what he called lifeboat economics and not on quality or even potential lifetime demand, he laid out a vision of the impact he expected the Internet and consumer choice would have on the structure of the media industry, foreshadowing many of the ideas that appeared in Chris Anderson's book The Long Tail: Why the Future of Business Is Selling Less of More (ISBN 1-4013-0237-8).
The Long Tail concept has found a broad ground for application, research and experimentation. It is a common term in the online business and mass media, but also of importance in micro-finance (see Grameen Bank), user-driven innovation (Eric von Hippel), social network mechanisms (e.g., crowdsourcing, crowdcasting, Peer-to-peer), economic models, and marketing (viral marketing).
Business model
A business model is a framework for creating economic, social, and/or other forms of value. The term business model is thus used for a broad range of informal and formal descriptions to represent core aspects of a business, including purpose, offerings, strategies, infrastructure, organizational structures, trading practices, and operational processes and policies.
In the most basic sense, a business model is the method of doing business by which a company can sustain itself -- that is, generate revenue. The business model spells-out how a company makes money by specifying where it is positioned in the value chain.
Conceptualization
Conceptualizations of business models try to formalize informal descriptions into building blocks and their relationships[1]. While many different conceptualizations exist[2][3][4][5][6][7][8][9], Osterwalder proposed[10] a synthesis of different conceptualizations into a single reference model based on the similarities of a large range of models, and constitutes a business model design template which allows enterprises to describe their business model:

![]()
Business model design template: Nine building blocks and their relationships, Osterwalder 2004[10]
Infrastructure
- Core capabilities: The capabilities and competencies necessary to execute a company's business model.
- Partner network: The business alliances which complement other aspects of the business model.
- Value configuration: The rationale which makes a business mutually beneficial for a business and its customers.
Offering
- Value proposition: The products and services a business offers. Quoting Osterwalder (2004), a value proposition "is an overall view of .. products and services that together represent value for a specific customer segment. It describes the way a firm differentiates itself from its competitors and is the reason why customers buy from a certain firm and not from another."
Customers
- Target customer: The target audience for a business' products and services.
- Distribution channel: The means by which a company delivers products and services to customers. This includes the company's marketing and distribution strategy.
- Customer relationship: The links a company establishes between itself and its different customer segments. The process of managing customer relationships is referred to as customer relationship management.
Finances
- Cost structure: The monetary consequences of the means employed in the business model. A company's DOC.
- Revenue: The way a company makes money through a variety of revenue flows. A company's income.
Evolution
A brief history of the development of business models might run as follows. The oldest and most basic business model is the shopkeeper model. This involves setting up a store in a location where potential customers are likely to be and displaying a product or service.
Over the years, business models have become much more sophisticated. The bait and hook business model (also referred to as the "razor and blades business model" or the "tied products business model") was introduced in the early 20th century. This involves offering a basic product at a very low cost, often at a loss (the "bait"), then charging compensatory recurring amounts for refills or associated products or services (the "hook"). Examples include: razor (bait) and blades (hook); cell phones (bait) and air time (hook); computer printers (bait) and ink cartridge refills (hook); and cameras (bait) and prints (hook). An interesting variant of this model is a software developer that gives away its word processor reader for free but charges several hundred dollars for its word processor writer.
In the 1950s, new business models came from McDonald's Restaurants and Toyota. In the 1960s, the innovators were Wal-Mart and Hypermarkets. The 1970s saw new business models from FedEx and Toys R Us; the 1980s from Blockbuster, Home Depot, Intel, and Dell Computer; the 1990s from Southwest Airlines, Netflix, eBay, Amazon.com, and Starbucks. Poorly thought out business models were a problem with many dot-coms.
Today, the type of business models might depend on how technology is used. For example, entrepreneurs on the internet have also created entirely new models that depend entirely on existing or emergent technology. Using technology, businesses can reach a large number of customers with minimal costs.
Examples over the years
- Subscription business model
- Razor and blades business model (bait and hook)
- Pyramid scheme business model
- Multi-level marketing business model
- Network effects business model
- Monopolistic business model
- Cutting out the middleman model
- Auction business model
- Online auction business model
- Bricks and clicks business model
- Loyalty business models
- Collective business models
- Industrialization of services business model
- Servitization of products business model
- Low-cost carrier business model
- Online content business model
- Freemium business model
- Premium business model
- Direct sales model
- Value Added Reseller model
- Professional open-source model
- Various distribution business models
Importance
Malone et al.[11] at MIT find that some business models, as defined by them, indeed performed better than others in a dataset consisting of the largest U.S. firms, in the period 1998 through 2002, while they did not prove whether the existence of a business model mattered.
Perhaps the most overlooked dimension in developing a business model especially for a new product/service/business is the dimension of time, more specifically the timing of investments/expenses or cash flow out versus the receipt of revenues/accounts receivables or cash flow in. The principle issues are: 1) Essentially how much of the product or service has to be built before customers can make some level of either actual purchase decision and/or purchase commitment? 2) How much investment/expense is required to secure these revenues/commitments from customers? and 3 )How much risk is there in achieving net positive cash flow, given the required upfront investment and the future time to capture revenues/receivables cash inflow, within an acceptable timeframe, if ever?
These business model issues often make or break new ventures. Business models that are optimized to reduce the upfront investment, that accelerate the revenue/receivables cash inflow, that obtain cogent and reliable customer feedback often and earlier, and that take other measures to reduce the investment risk all have a higher probability of business success.
For example, in the entertainment industry, does one have to produce a movie for $100 million plus before any box office revenues can be derived, or can the business model be evolved by licensing certain established characters/signing leading movie stars for secondary licensing rights for fast-food chain promotional-tie-ins, movie merchandise licenses, etc. can generate pre-release cash inflow through licensing fees? Or a different entertainment business model might be to create and promote a "Weirdest Video" website platform for users to contribute the content and then based on site traffic, sell advertising for revenues. Here, the upfront investment for creating and promoting the site could be a fraction of the investment to produce a movie and the chances that it would be more popular than a movie may be much higher, as it can be tweaked as it is developed while a movie is an all-or-nothing production.
It comes down to a nitty gritty question: Can we make to order or do we have to create a new mousetrap and then wait to see if the world will come to it, or somewhere in-between?
Related Concepts
The process of business model design is part of business strategy. The implementation of a company's business model into organizational structures (e.g. organigrams, workflows, human resources) and systems (e.g. information technology architecture, production lines) is part of a company's business operations. It is important to understand that business modeling commonly refers to business process design at the operational level, whereas business models and business model design refer to defining the business logic of a company at the strategic level.